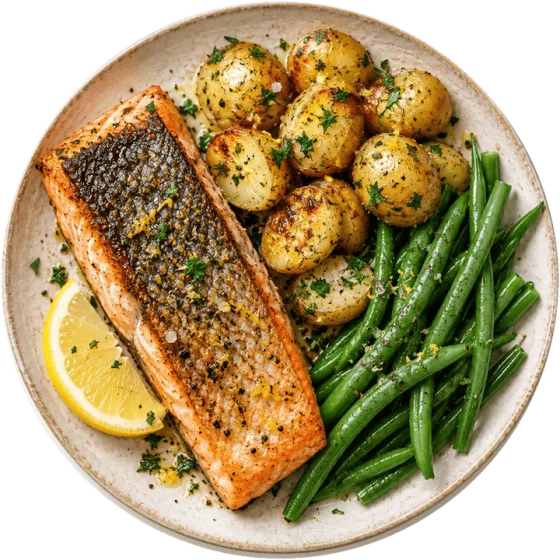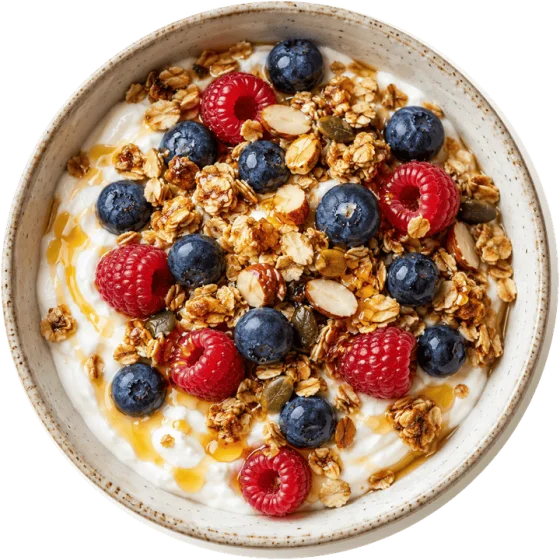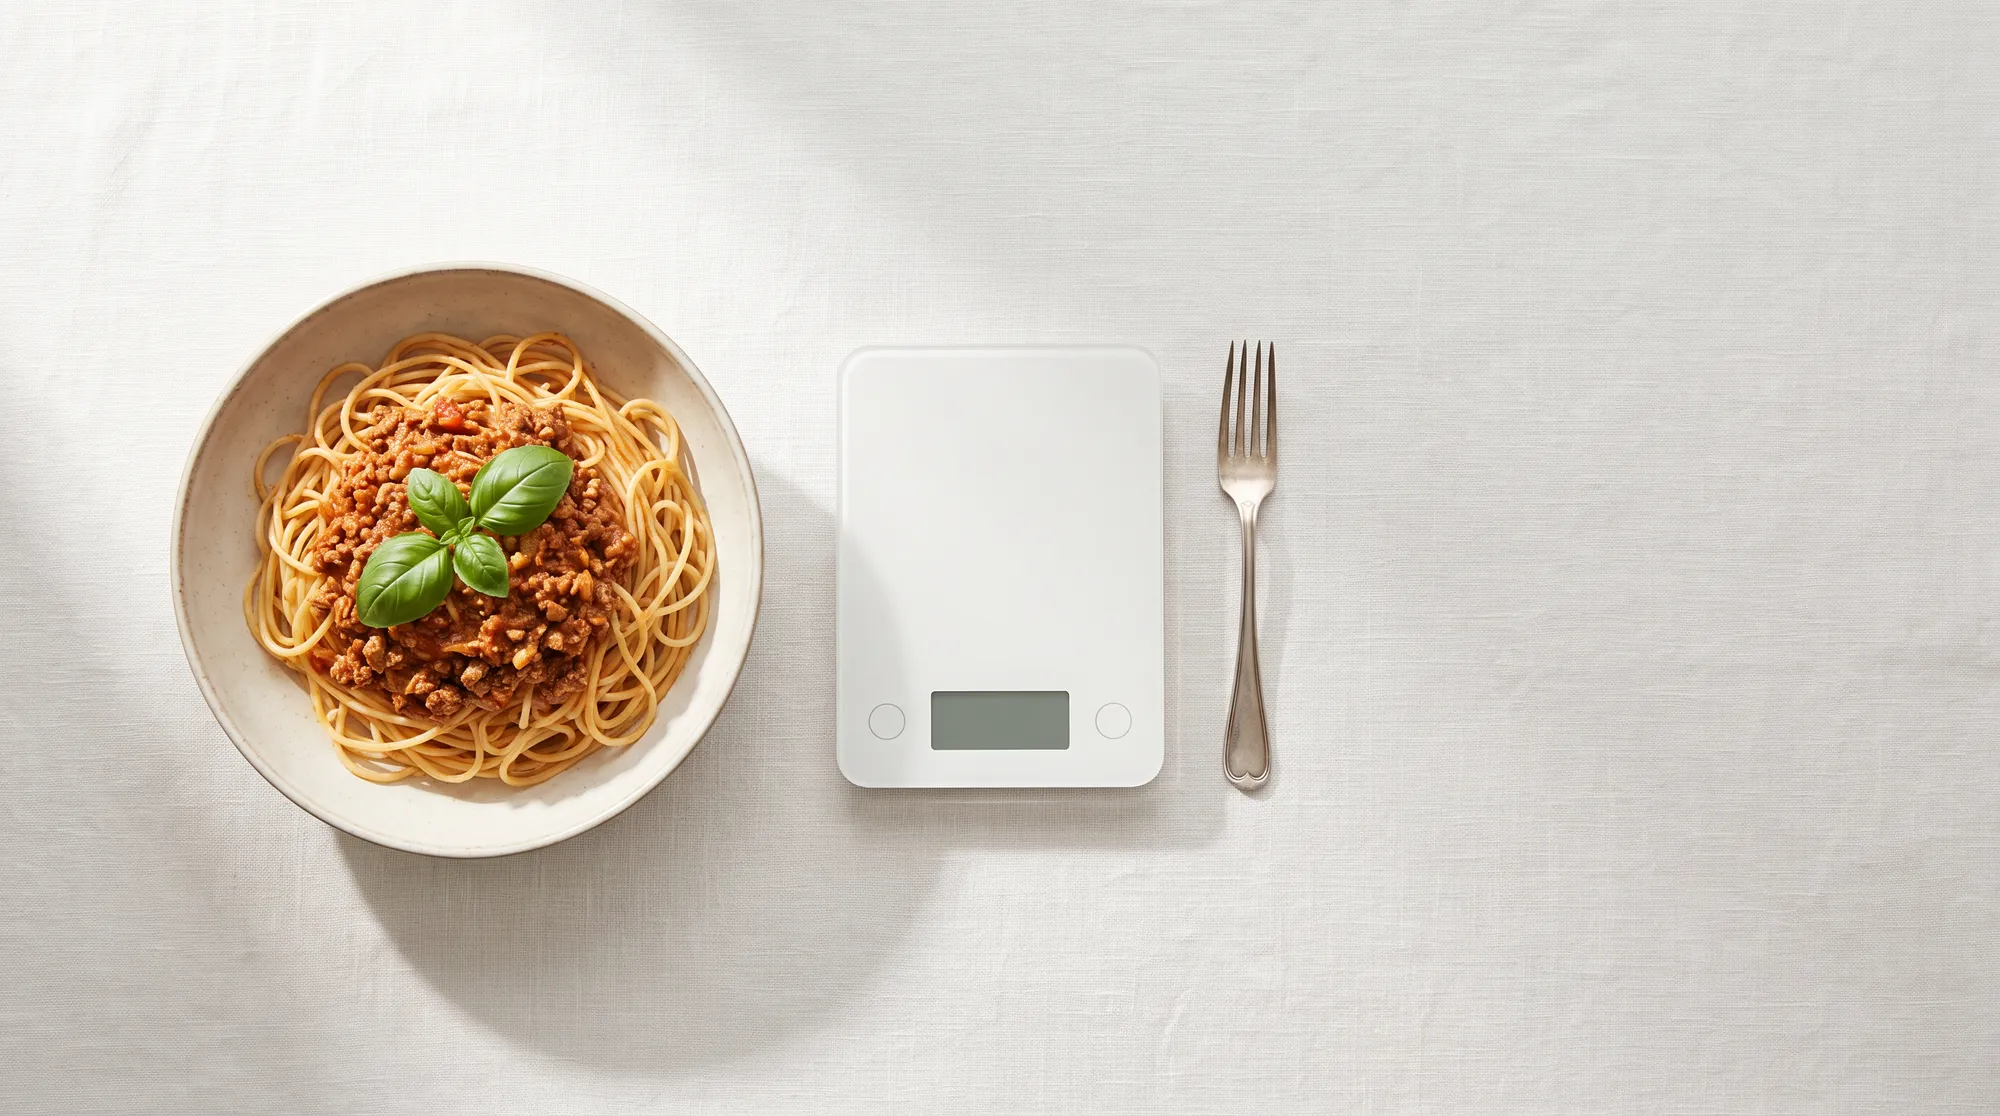
Photograph a meal, and a few seconds later an app tells you it’s 640 calories. It’s a fair question how much of that number is real. Published studies of AI photo estimates put typical errors for mixed meals somewhere between 10% and 40%. Tell the AI what’s in the dish, and the error drops.
That sounds worse than it is, for one reason most articles skip: every calorie number you have ever seen was an estimate. The label on your yoghurt, the figure on a restaurant menu, and the number you’d have written down yourself are all estimates too. So the useful question isn’t whether AI is perfect. It’s whether it’s better than what you’d otherwise do, and whether the errors it makes are the kind that matter.
Nothing you eat comes with an exact number
Start with food labels. In the UK and the EU, the figure on a label is an average from the maker’s analysis or recipe, and enforcement guidance lets the true protein, carbohydrate and fat content of most foods sit up to 20% either side of it.5 Natural foods vary; a banana is not a standard unit.
Restaurants are looser. When researchers in the US measured dishes in a lab, restaurant meals contained on average 18% more energy than stated, and some contained twice as much. Free side dishes took some meals to well over double the calories on the menu.3
And then there’s us. A BMJ study asked diners leaving fast-food chains to guess the calories in the meal they had just eaten. Meals averaged 836 kcal, and adults underestimated them by 175 kcal on average. A quarter were out by 500 kcal or more, and the bigger the meal, the bigger the miss.2 In a famous 1992 study, a group of people who said they couldn’t lose weight on very little food were measured precisely for two weeks. They were under-reporting what they ate by 47% on average, and over-reporting their exercise by about half.4 It was a small group, and nobody was lying. Most of us simply don’t notice what we eat.
Fig. 1How far off can a calorie number be?
What the research says about AI
Most studies give an AI a photo of a meal whose ingredients were weighed in advance, then compare its estimate with the real figure. Results vary widely between studies because the meals vary. A plain apple or a slice of toast is easy. A curry, a casserole or a loaded salad is hard, because the calories are in things the camera can’t measure.
The most useful recent study tested a current general model in four ways: a photo alone, a photo with a short description, a photo with a list of ingredients and amounts, and the list alone. Accuracy improved at every step. With the photo and the ingredient amounts, the average error for energy was about 53 kcal per dish. Remove the photo, keep the list, and the error rose to about 67 kcal, so the picture was adding real information rather than just decorating the maths.1
A photo plus a few words beats either on its own. That one finding is the most practical thing in this whole article.
Where AI estimates go wrong
The errors aren’t random. They cluster in a few predictable places, and once you know them you can close most of the gap yourself.
- Fat you can’t see. A tablespoon of olive oil is about 120 kcal and is invisible once it’s in the pan. Butter on toast, oil in a dressing and cream in a sauce are the biggest single source of missed calories.
- Depth and density. A photo is flat. A deep bowl of pasta and a shallow one look much the same from above, and so do a light and a packed spoonful of rice.
- Look-alikes. Full-fat and light mayonnaise, whole and skimmed milk, regular and diet cola. The camera can’t tell, and the difference can be hundreds of calories over a day.
- Things that aren’t on the plate. The latte you drank on the way, the biscuits in the meeting, the bites while cooking. No tracker can estimate a meal you never log.
Fig. 2What a photo of a stir-fry can’t see
Why it still works
Two properties of estimation errors make tracking far more forgiving than the numbers above suggest.
Random errors partly cancel
If each meal is off by up to 25% in a random direction, the day isn’t off by 25%. Some meals are overestimated and some under, and they partly cancel. Across four independent meals, the error on the total shrinks to roughly half, and across a week it shrinks further.
Fig. 3A day is more accurate than any one meal
Consistent errors get calibrated out
The errors that don’t cancel are the consistent ones: an app that always reads your lunches 10% low, or a habit of never logging cooking oil. But consistent errors have a simple fix, which is your weight trend. If you log about 2,000 kcal a day for three weeks and your trend weight doesn’t move, then logged 2,000 is your maintenance, whatever the true number is. Eat a bit less than that, as measured by the same method, and you’ll lose weight.
That’s why the best predictor of success with any tracker isn’t its accuracy on a single meal. It’s whether you log consistently enough for the trend to tell you the truth.
How to get better numbers from any tracker
- Add a few words. “Cooked in a tablespoon of butter”, “large bowl”, “with full-fat mayo”. It’s the cheapest accuracy you’ll ever get.
- Name the hidden extras. Oils, dressings, sauces, milk in drinks and sugar in tea. These are where most missing calories live.
- Give a reference for portions. “A 400 g tin”, “two slices”, “a fist-sized portion” mean far more than “some”.
- Scan packaged food. A barcode gives you the label’s figure, which is as good as it gets for packaged food.
- Weigh a few meals, once. Weighing your usual bowl of cereal or pasta once or twice trains your eye for every meal after.
- Judge by the two- to three-week trend, not by any single day. Daily weight is mostly water (more on that in why your weight jumps around).
How we handle it in CutWise
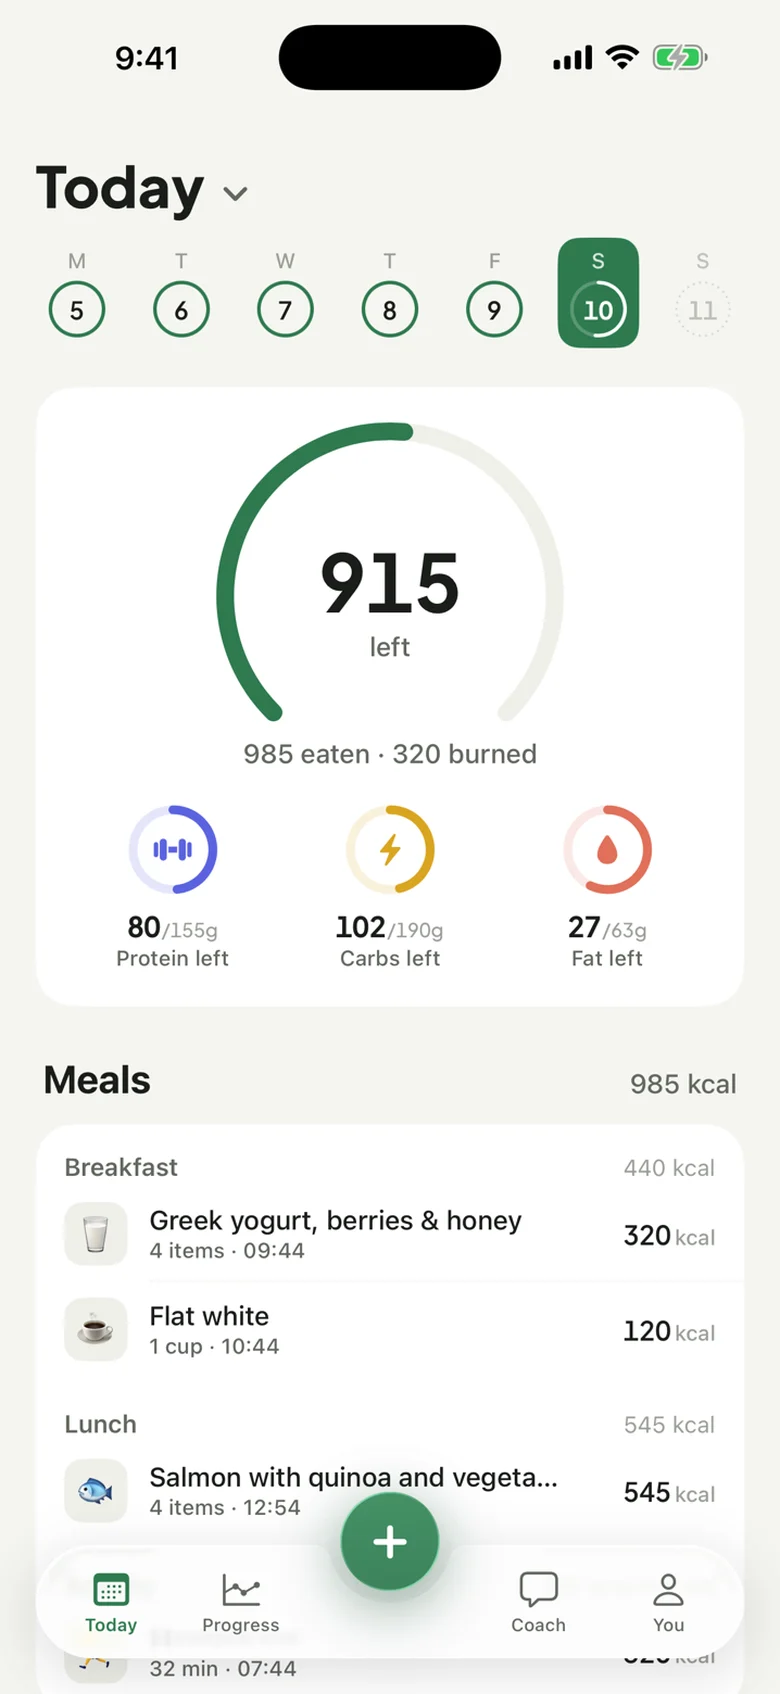
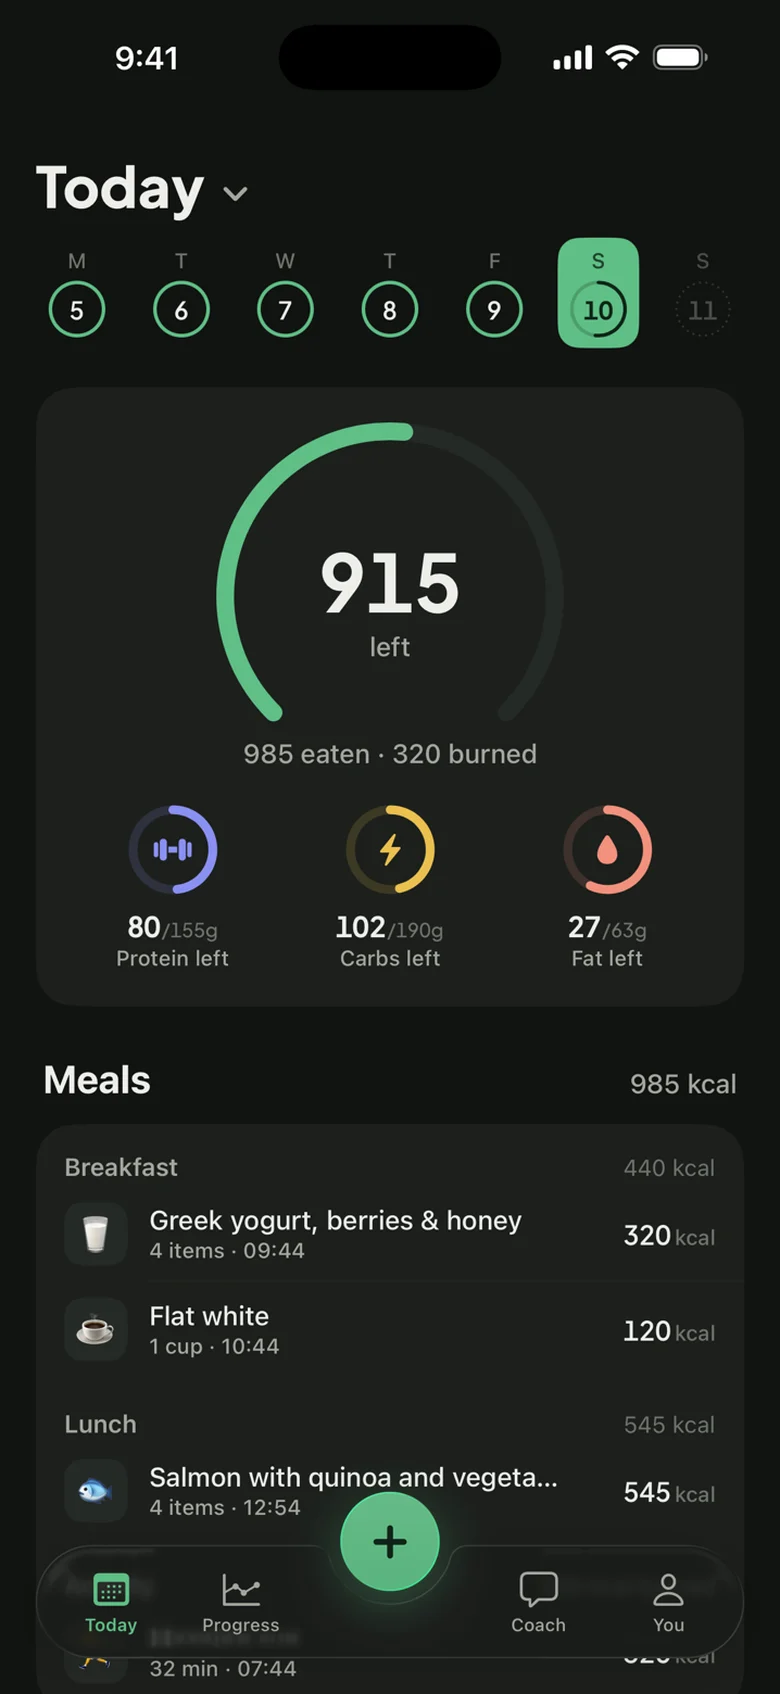
We designed CutWise around the findings above. You can log a meal by photo, by voice or by typing a sentence, and you can mix them: snap the plate and say “fried in butter, large portion”. When the AI genuinely can’t tell what something is, it asks you a short question rather than guessing. Every item stays editable, packaged food can be scanned, and your weight chart shows a smoothed trend, so the number you calibrate against isn’t thrown around by a salty dinner.
None of that makes an estimate exact. Nothing does. But it makes the estimate honest, quick to correct, and consistent enough for your weight trend to do the rest.